
The sample is generated by raz99.com. It can be downloaded and changed to adapt to your own needs. It is free.
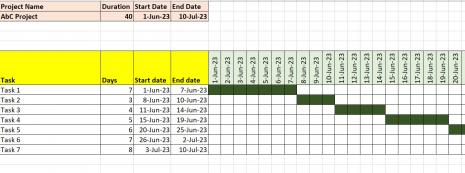
A Gantt chart is a visual representation of a project schedule that uses horizontal bars to illustrate the start and end dates of tasks, as well as their dependencies and durations. Here are some reasons why Gantt charts are commonly used in project management and why they are beneficial:
Project Planning: Gantt charts provide a clear overview of project tasks, timelines, and dependencies. They help project managers and team members visualize the project schedule, understand the sequence of activities, and identify any potential bottlenecks or conflicts. This aids in effective project planning and resource allocation. Task Dependencies: Gantt charts allow you to define task dependencies, such as "Task B cannot start until Task A is completed." By visualizing these dependencies, you can better understand the critical path of your project and identify tasks that are dependent on others. This helps you manage interdependencies and ensure that tasks are scheduled in the correct order.
Timeline Management: Gantt charts provide a timeline view of the project, allowing you to see the start and end dates of each task. This helps in managing deadlines, tracking progress, and identifying any schedule slippages or delays. By visualizing the project timeline, you can make informed decisions and take appropriate actions to keep the project on track. Resource Allocation: Gantt charts help in managing resources effectively. By mapping out the tasks and their durations, you can identify any resource conflicts or overloading. This enables you to adjust the schedule, allocate resources efficiently, and avoid bottlenecks or resource shortages.
Communication and Collaboration: Gantt charts serve as a communication tool for project teams, stakeholders, and clients. They provide a visual representation of the project schedule that is easy to understand and share. Gantt charts facilitate effective communication about project timelines, progress updates, and milestones. They also help stakeholders visualize the project's overall progress, increasing transparency and collaboration among team members.
Project Tracking: Gantt charts enable you to track the progress of tasks against the planned schedule. By updating the chart with actual start and end dates, you can compare them to the planned dates and identify any variances or deviations. This helps in monitoring project performance, identifying potential delays, and taking corrective actions to keep the project on track.
Overall, Gantt charts in Excel or any other project management software provide a comprehensive and visual representation of project schedules, helping project managers and teams effectively plan, track, and manage projects from start to finish.